The standard Soybean futures contract (ZS) rose 1% on Tuesday after the release of the World Agricultural Supply and Demand Estimates (WASDE) report for February. The gains have faded since.
The February print came largely in line with expectations as typically it comes just after the USDA’s final Crop production report in January, which already incorporates most of the finalized supply-side data.
China Chatter moves Soybean? In the WASDE report published on Tuesday, the U.S. Department of Agriculture (USDA) said China is reportedly toying with the idea of buying more soybeans from the U.S. That said, the agency said global import demand is broadly unchanged from January. “So therefore if China bought more from the United States, global soybean exports will likely be shifted with more U.S. shipments to China and less to other markets.”
Soybean: U.S. soybeans supply and use projections for the 2025/26 season were largely unchanged in February. The February soybean ending-stock projection for 2025/26 was 350 million bushels, unchanged from the previous month.
Corn inventory drawdown was projected, with the USDA estimating the 2025/26 ending stocks at 2.127 billion bushels in February, down from 2.227 billion bushels forecast in January. The agency attributed the reduction to greater exports, which have now been hiked by 100 million bushels to 3.3 billion bushels.
For wheat, the other major agricultural commodity, the 2025/2026 U.S. outlook published in February showed unchanged supplies, modestly lower domestic use, unchanged exports and slightly higher ending stocks. The ending stock has been hiked to 931 million bushels from 926 million bushels in January.
What Charts Tell: After a sharp retreat in mid-January that followed a consolidation phase, corn futures have ground higher and are on short-term uptrend. Given fundamental data that shows tight inventories, traders can accumulate on any pullback or if the breakout continues. Stop loss can be set below the 423.56 cent/bushel, which happens to be a near-term support.
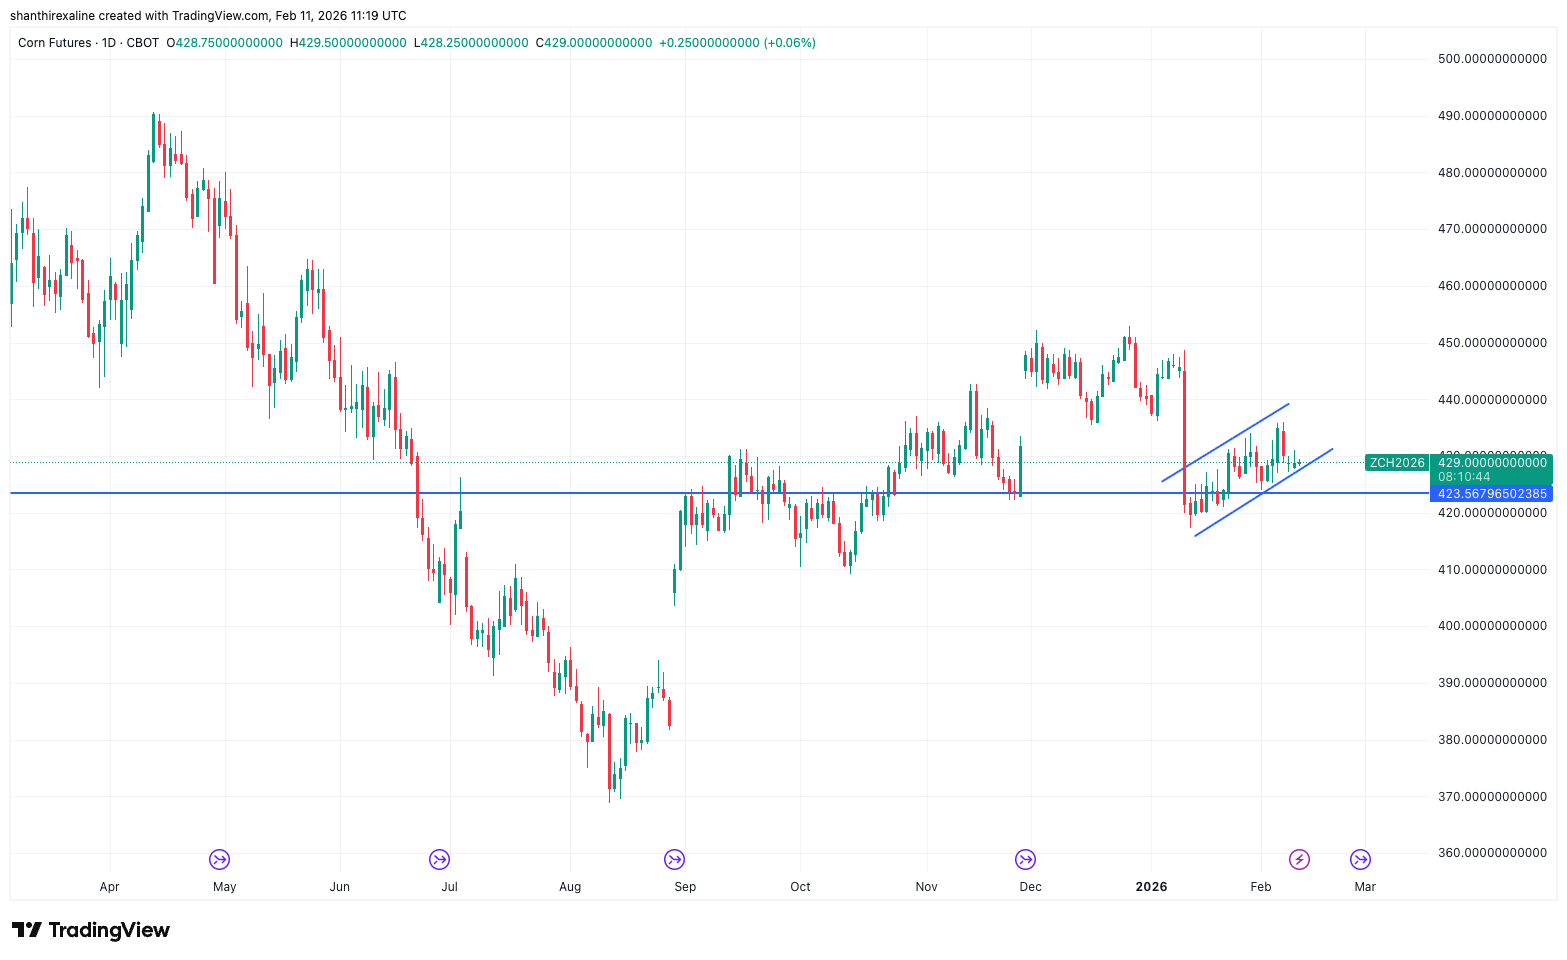
Source: TradingView
The one-year soybean chart shows the futures struggling to break above the shoulder of a head-and-shoulder pattern from late last year. If the rally stalls, the next downside support could be around 1,105.5 cents/bushel. Watch out also for a potential bearish crossover as the 100-day simple moving average (SMA) is on the verge of crossing over the 50-day SMA.
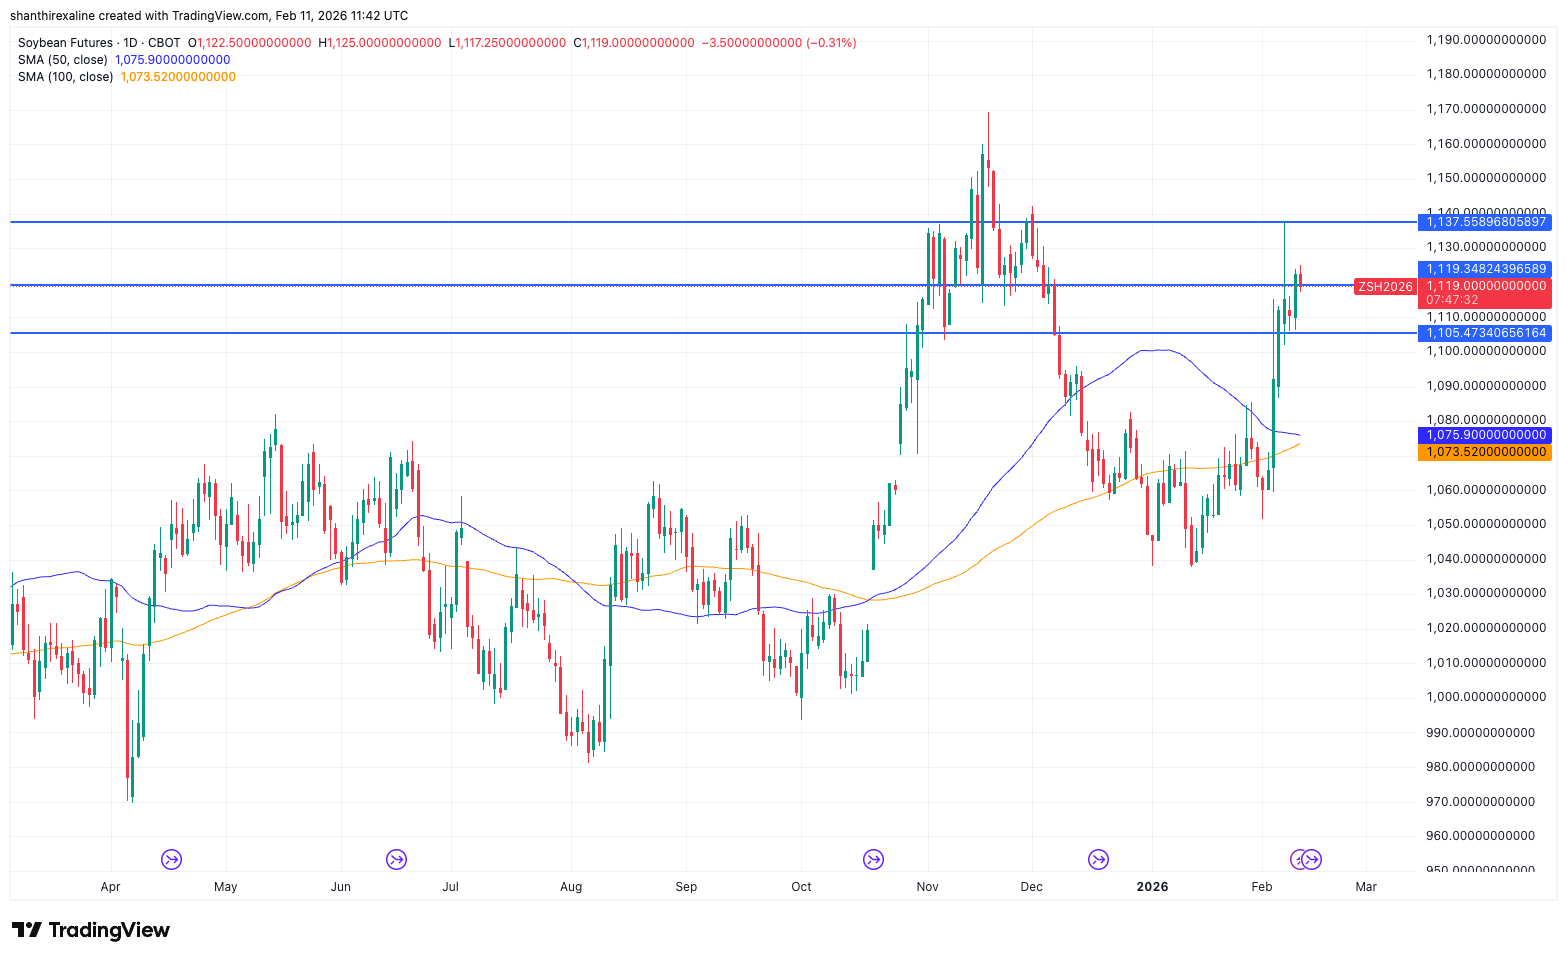
Source: TradingView
If the price rallies into the resistance zone (the “shoulder” area of a head-and-shoulders pattern), and the futures stumble at that level, it is advisable to sell into the strength if the breakout fails to materialize.
Read Next: Crude Oil Bears Take Control as EIA Flags Oversupply Risk: Can CL Defend the $62.5 Floor?