The major stock index futures have staged a modest recovery from the oil shock-induced weakness seen last week. The reversal in sentiment reflected investor hopes that the war involving Iran and the U.S.-Israel combination would soon come to an end.
Will the February consumer price inflation report due on Wednesday impede the fledgling recovery?
Traders on High Alert: The Bureau of Labor Statistics (BLS) is due to release the February inflation print at 8:30 a.m. ET. Here’s what the consensus is modeling versus January readings:
- Monthly CPI rate: 0.3% Vs 0.2%
- Annual CPI: 2.4% (unchanged from January)
- Monthly core CPI: 0.2% Vs 0.3%
- Annual core CPI: 2.5% (unchanged from January)
After CPI inflation spiked in mid-2022, the Federal Reserve combatted the inflationary environment with a series of rate hikes.
Headline US Annual Inflation

Source: BLS
Although the annual rates of the headline and core inflation continued to remain above the central bank’s 2% target, they began to chart a downward trajectory, beginning in September 2024.
US Federal Funds Target Rate
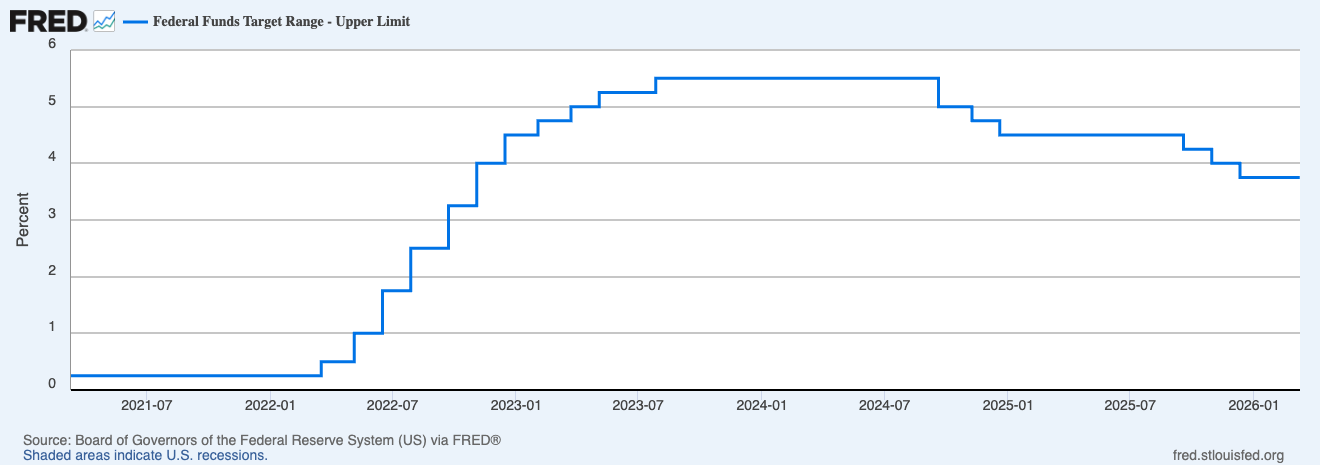
Source: Chicago Fed
The next meeting of the Fed's rate-setting committee, namely the Federal Open Market Committee (FOMC), has been scheduled for March 17-18. According to the CMEFed Watch Tool, the odds of a pause decision that could leave rates unchanged at 3.50%-3.75% is 97.4%.
CME FedWatch Tool
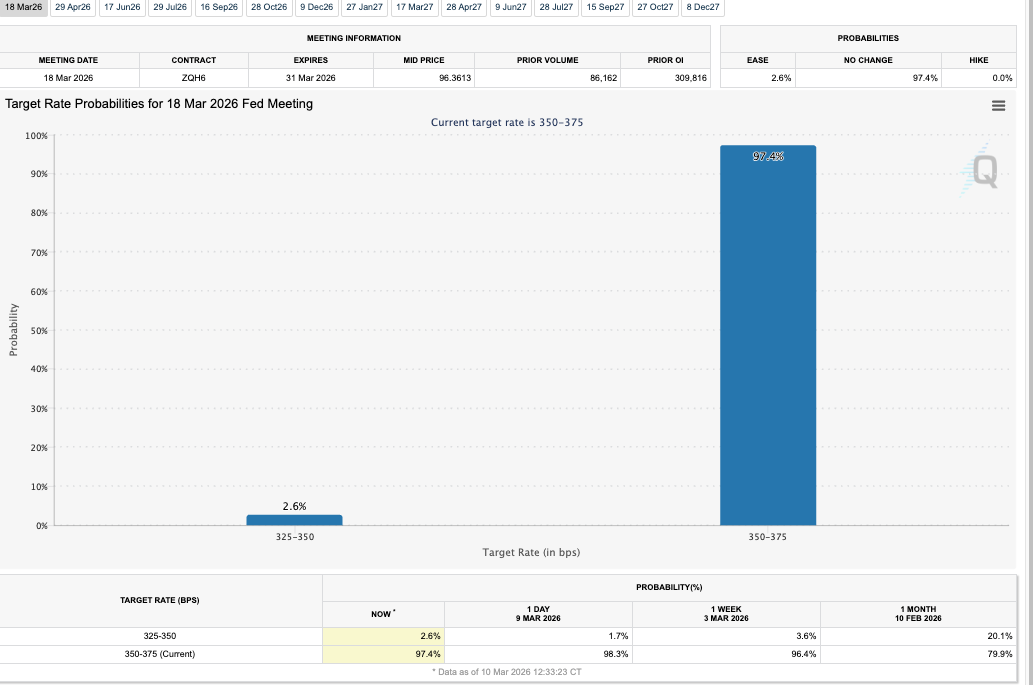
Source: Federal Reserve
What Economists Expect:
- Comerica Chief Economist Bill Adams expects the report to likely run cool as tame housing costs offset the effects of tariffs. Grocery price inflation was likely tame during the month.
- Morgan Stanley expects February core CPI to rise 0.27% MoM (2.5% YoY) and headline CPI to increase 0.33% MoM (2.5% YoY). The firm sees core services decelerating as airfares and medical services soften following strong January prints, and shelter inflation accelerating modestly but remaining close to its underlying trend, with owners-equivalent rent and rents rising about 0.26% MoM. It expects core goods inflation to be near zero, as seasonally adjusted used car prices, which are less exposed to tariffs, decline, and new vehicle prices move sideways.
Implications for ES, NQ Futures:
The S&P 500 E-mini futures (ES), which slipped below a near-term trading range (6,774.75-7,016.50) amid oil’s surge following the U.S.–Iran war, have since recovered and returned to the range.
Nasdaq 100 futures (NQ) are also seen oscillating within a 24,025–25,428 range. If the contract tied to the Nasdaq 100 Index breaks above the upper bound, it could remain on track to challenge its all-time highs above the 26,000 level.
For both futures contracts, a break below the lower bound of their recent trading ranges could pave the way for a deeper pullback.