Amazon’s fourth-quarter report rounded out big tech hyperscaler earnings within the Magnificent Seven companies, and it only served to aggravate fears of a spending spree that would be hard to justify even after accounting for the payback.
Artificial intelligence, the tech world’s latest buzzword, has generated its fair share of excitement, skepticism, and fears. Only recently, Anthropic sent shockwaves through the software space with the release of plugins for its workplace AI assistant called Claude Cowork, which could author documents and organize files and therefore could be deployed in sectors such as legal and finance.
Capex Extravagance: Hyperscalers Microsoft, Alphabet’s Google, Meta, and Amazon all reported over the past couple of weeks, and the common vein running through all their quarterly reports is the capex that is rising in geometric proportion.
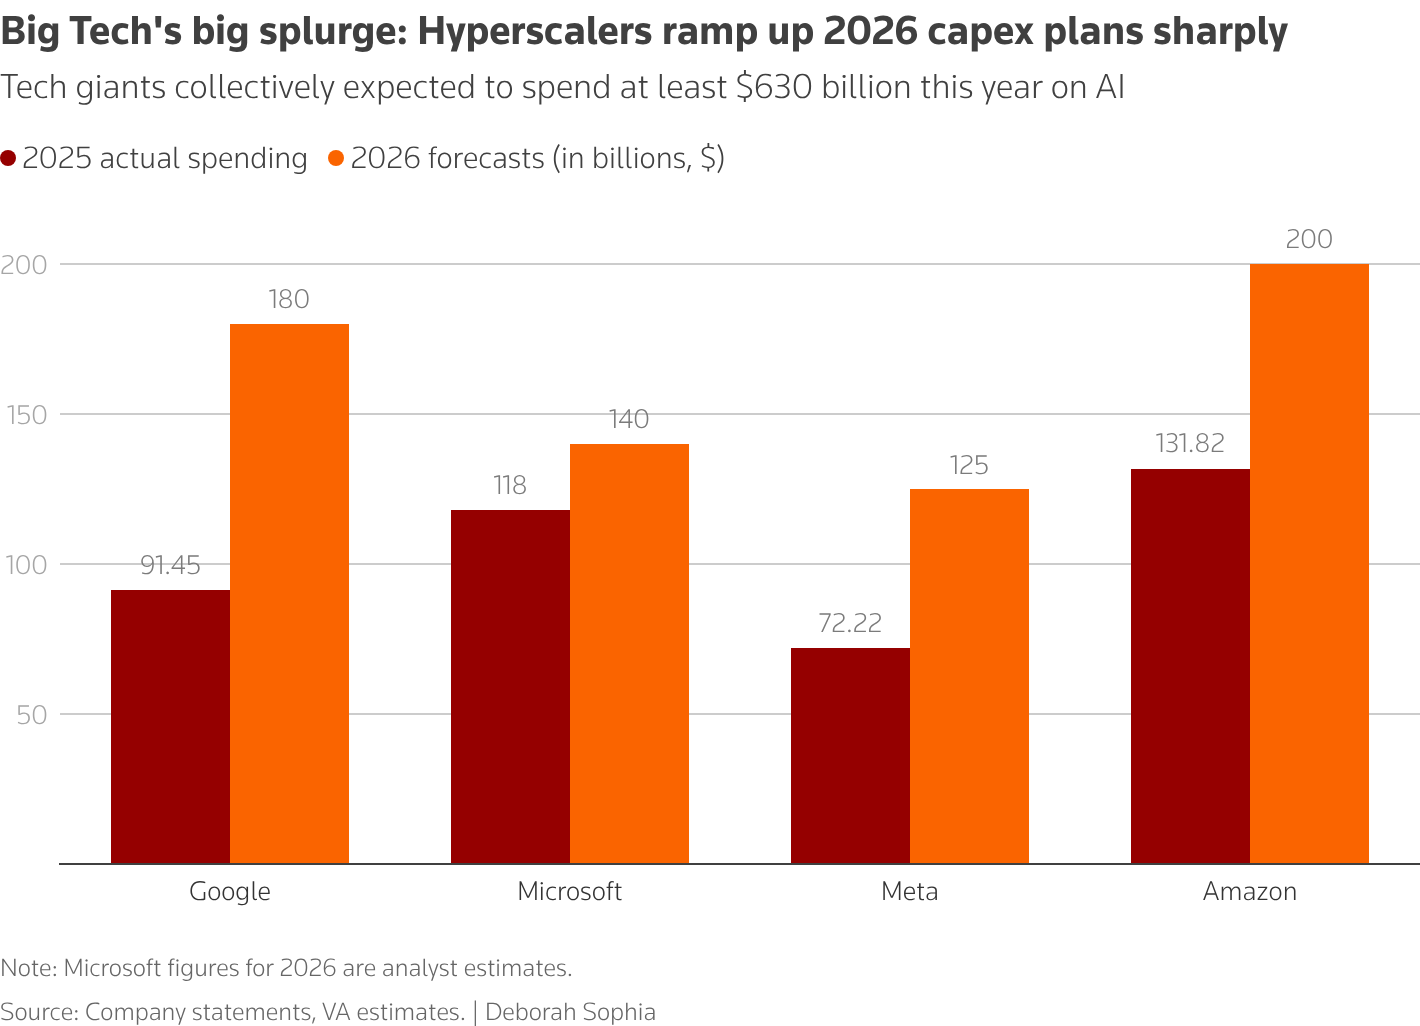
Source: Reuters
The current bull run has largely been fueled by the AI trade, which has picked up pace with the popularity of OpenAI’s ChatGPT large-language model (LLM), launched in late 2022. The S&P 500 Index, a broader gauge of U.S. stock market activity, has never looked back since, barring periodic pullbacks amid risk events such as President Donald Trump’s tariff announcement in April 2025.
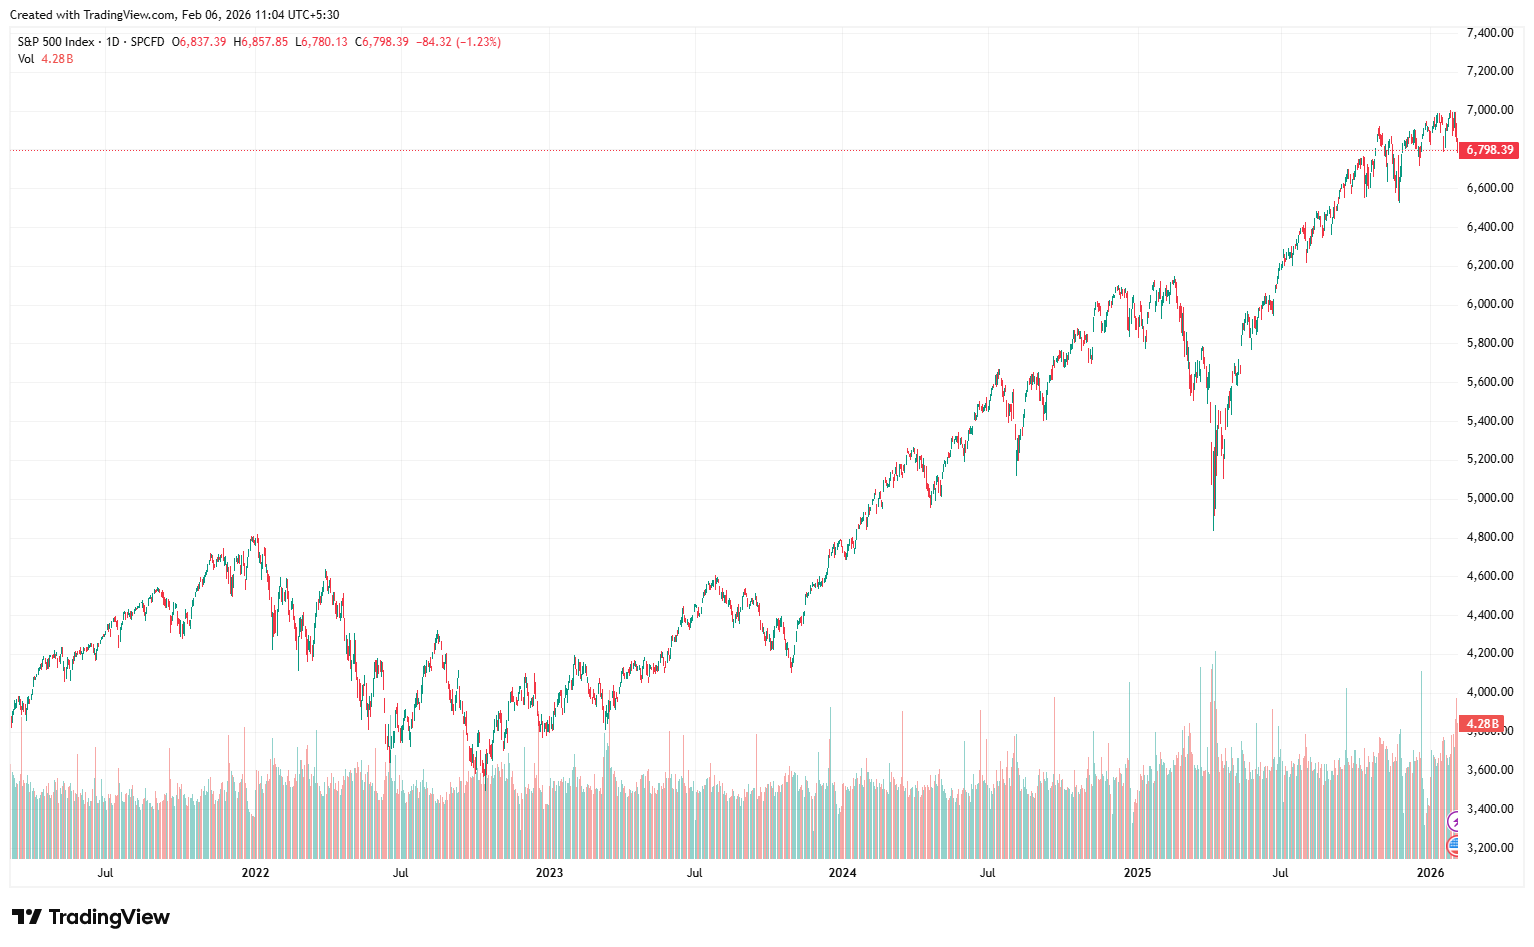
Source: TradingView
The outsized index weighting of hyperscalers means that any material unwinding of the AI trade could amplify downside risk and lead to a market correction.
Add to it the macro and geopolitical risks, and it becomes a perfect concoction of what all could go wrong. The monetary policy outlook is uncertain, especially after Trump picked hawkish-leaning former Federal Reserve Governor Kevin Warsh as his nominee for the Fed chair. Geopolitical risks continue to pose a headwind, especially with the U.S. standoff with Iran and Trump’s tariffs that have now become his go-to threat.
How Stock Futures Traders Should Position: The ES has hit an all-time high of 7,008.50 in late January, but it has been range-bound since recovering from its late November low. In the last three sessions, ES has been making lower lows amid the AI fears, suggesting some degree of bearishness. The pullback has also pushed the 14-day relative strength in the oversold zone
The near-term downtrend took it below the 100-day simple moving average (SMA) at 6,833, but it has held support around the lower bound of the recent trading range (6,758) before closing above it.
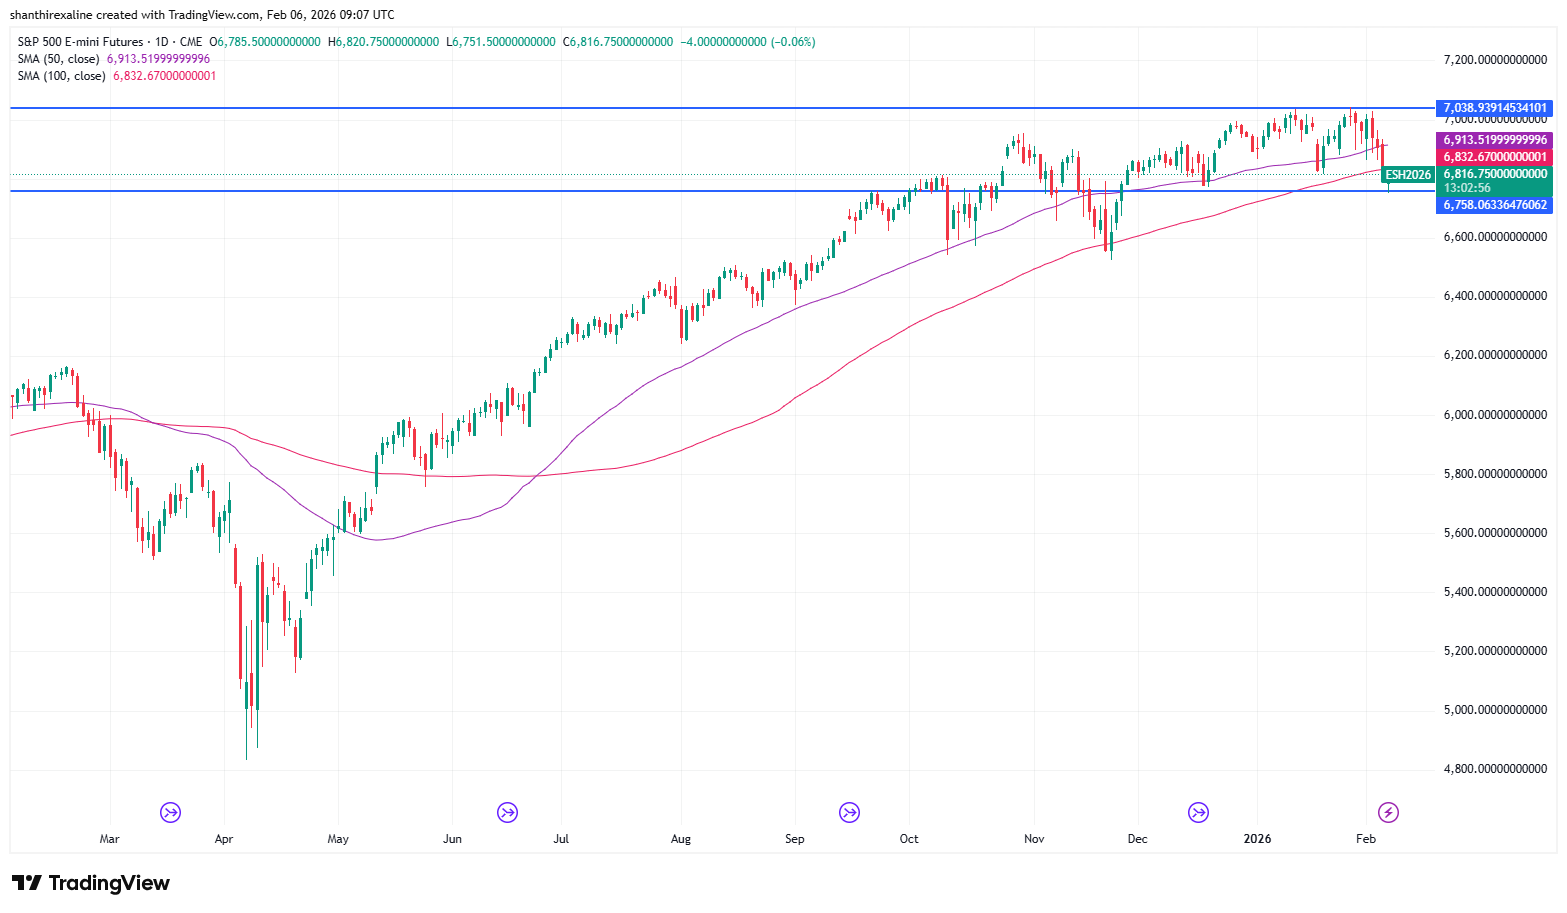
Source: TradingView
If ES breaks below 6,758, traders can look to initiate a short position either:
- on the clean breakdown through 6,758, or
- more conservatively, after a failed retest of 6,758
For protection, place stops above 6,800, as a reclaim above this zone would signal the breakdown is losing momentum and could trigger a squeeze back toward the 100-day SMA. On the upside, a breakout above 6,862 — the neckline of the recent triple top formation — is key.
The January non-farm payrolls report, which is due on Friday, has now been delayed until Feb. 11 due to the partial government shutdown earlier this week. Watch out for the University of Michigan’s preliminary consumer sentiment report for February and next week’s inflation readings for near-term trading cues.